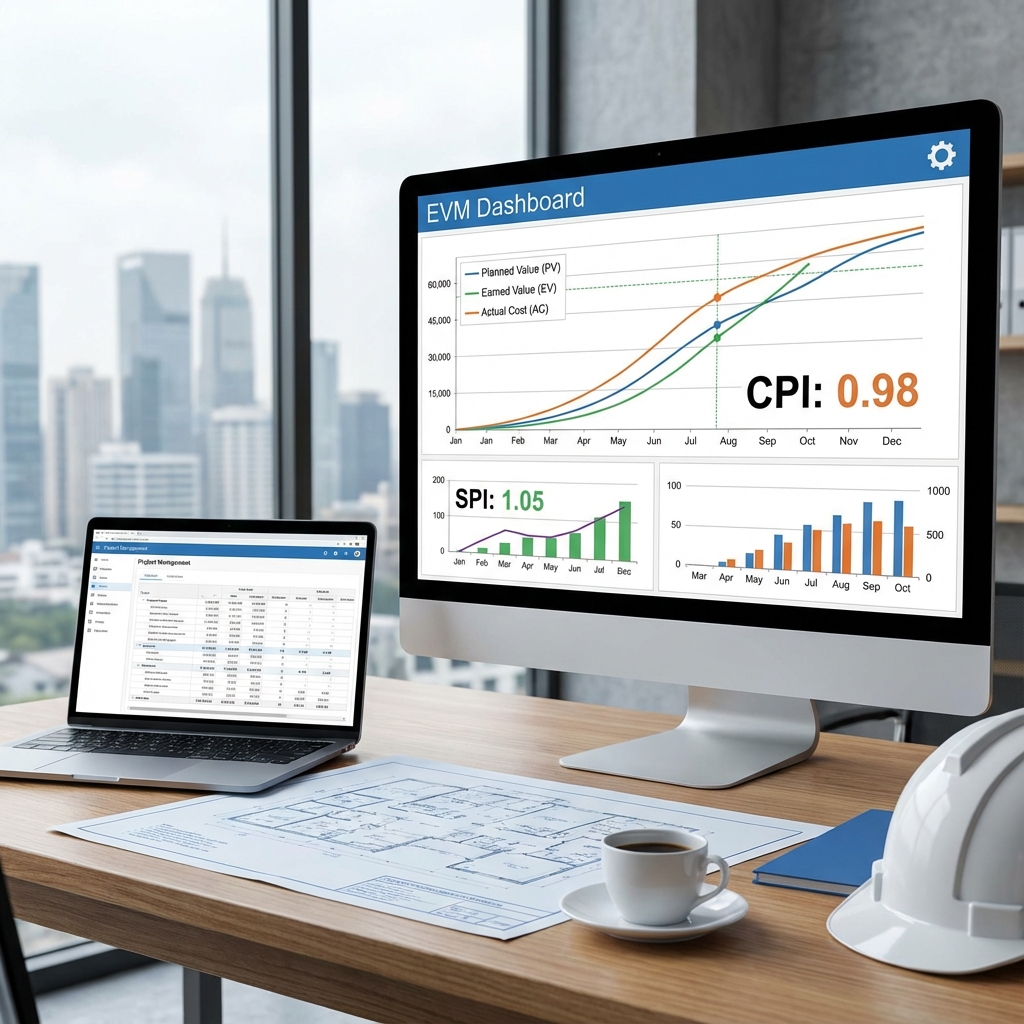
مبادئ EVM المتقدمة وتطبيقاتها في المشاريع الكبيرة
إدارة القيمة المكتسبة (EVM) تُعدّ من أكثر منهجيات قياس الأداء موثوقية في صناعة البناء والمشاريع الكبرى. ما يميزها عن الأساليب التقليدية هو أنها لا تعتمد على حكم شخصي أو تقدير ذاتي، بل على قياسات موضوعية مستخرجة مباشرة من بيانات المشروع الفعلية. هذا يجعل تقارير EVM مقبولة ومصداقة عند العملاء والممولين والجهات الرقابية على حدٍّ سواء.
في المشاريع الحكومية الكبرى في منطقة الخليج، أصبح EVM متطلباً إلزامياً في كثير من العقود، خاصة تلك الممولة من البنوك الدولية أو الشركات البترولية الكبرى مثل أرامكو وأدنوك. مدير المشروع الذي يتقن EVM يتمتع بميزة تنافسية واضحة ويستطيع الدفاع عن أداء مشروعه بأرقام واضحة لا بتبريرات مجردة.
التكامل بين EVM وإدارة المخاطر
أحد الاستخدامات المتقدمة لـ EVM هو ربطه بتحليل المخاطر. المشاريع التي تُظهر CPI أقل من 0.9 في مرحلة مبكرة تُعدّ في منطقة خطر مرتفعة الاحتمال لتجاوز الميزانية الكلية. وبالمثل، SPI أقل من 0.85 يُنبّه لاحتمال عدم التسليم في الموعد المتعاقد عليه. هذه المؤشرات تُمكّن مدير المخاطر من تفعيل خطط الاستجابة المبكرة قبل أن تتحول المشكلة إلى أزمة.
في مشاريع البنية التحتية والنفط والغاز، يُستخدم EVM مع تقنية Monte Carlo Simulation للتنبؤ بنطاق تكلفة الإتمام المتوقعة (EAC) مع مستوى ثقة محدد. على سبيل المثال، قد تكون EAC الأكثر احتمالاً 120 مليون ريال بنسبة ثقة 80% وقد ترتفع إلى 135 مليون في سيناريو التفاؤل البسيط. هذا النوع من التحليل يُقدّم صورة أكثر واقعية للإدارة العليا.
أفضل الممارسات لضمان دقة تقارير EVM
التحدي الأكبر في تطبيق EVM ليس فهم المعادلات، بل ضمان دقة بيانات المدخلات. إذا كانت نسب الإنجاز المُدخلة غير دقيقة، تصبح تقارير EVM مضللة وخطيرة. لضمان الدقة:
- حدد طريقة قياس الإنجاز بوضوح لكل نوع نشاط قبل بدء المشروع في وثيقة EVM Setup Plan.
- استخدم الإنجاز الفيزيائي المقاس (Physical Quantities) كلما أمكن بدلاً من تقدير النسبة المئوية.
- ربط التحديثات بدورة تقرير منتظمة أسبوعية أو نصف شهرية مع تحديد شخص مسؤول عن كل حزمة عمل.
- مراجعة مستقلة من مهندس تحكم بالتكاليف (Cost Controller) لا يتبع لقسم الإنشاء لضمان الحياد.
EVM في المشاريع الصغيرة والمتوسطة
كثير من المهندسين يعتقدون أن EVM محصور في المشاريع الضخمة. الحقيقة أنه يُمكن تطبيق المبادئ الأساسية حتى في مشاريع متوسطة بتكاليف 5-20 مليون ريال باستخدام جداول Excel بسيطة دون الحاجة لبرامج متخصصة. ما يهم هو الانتظام في تحديث البيانات والصدق في قياس الإنجاز.
م. سامح بدوي سيد
مهندس مدني ومتخصص في BIM وإدارة المشاريع. خبرة في التخطيط وإدارة التكاليف في منطقة الشرق الأوسط. مؤسس منصة BIMitPlaniT.
🎯 What You'll Learn in This Course
- ✅ EVM fundamentals and history
- ✅ Core metrics: PV, EV, AC
- ✅ Variance analysis: CV, SV
- ✅ Performance indices: CPI, SPI
- ✅ Forecasting: EAC, ETC, VAC, TCPI
- ✅ S-Curves and reporting
- ✅ Real-world worked example
📋 Course Contents
1 Module 1: What is EVM?
1.1 Definition
Earned Value Management (EVM) is a project management methodology that integrates scope, schedule, and cost to objectively measure project performance and progress.
🔑 The Core Question EVM Answers
"For every dollar spent, how much value did we actually earn?"
1.2 History
- 1960s: Developed by US DoD for defense projects
- 1967: Cost/Schedule Control Systems Criteria (C/SCSC)
- 1990s: Adopted by PMI and commercial sector
- Today: Standard in PMBOK, ISO 21508
1.3 Why Traditional Methods Fail
| Scenario | Traditional View | EVM View |
|---|---|---|
| Spent 50% of budget | "We're on track" | "But only 40% work done = Over budget!" |
| Spent less than planned | "We're saving money" | "But behind schedule = Problem!" |
2 Module 2: Core Metrics (PV, EV, AC)
2.1 Planned Value (PV)
"What we PLANNED to accomplish by now"
PV is the authorized budget for work scheduled to be completed by a specific date.
2.2 Earned Value (EV)
"The VALUE of work we ACTUALLY completed"
EV is the budget authorized for the work that has been completed. This is the "heart" of EVM.
2.3 Actual Cost (AC)
"What we ACTUALLY SPENT"
AC is the total cost incurred for the work performed.
2.4 Budget at Completion (BAC)
"The complete authorized budget"
3 Module 3: Variances (CV, SV)
3.1 Cost Variance (CV)
| Result | Meaning |
|---|---|
| CV > 0 | Under budget ✅ |
| CV < 0 | Over budget ❌ |
| CV = 0 | On budget |
3.2 Schedule Variance (SV)
| Result | Meaning |
|---|---|
| SV > 0 | Ahead of schedule ✅ |
| SV < 0 | Behind schedule ❌ |
| SV = 0 | On schedule |
4 Module 4: Performance Indices (CPI, SPI)
4.1 Cost Performance Index (CPI)
"Dollars of value per dollar spent"
| Result | Meaning |
|---|---|
| CPI > 1.0 | Getting more value than cost ✅ |
| CPI < 1.0 | Spending more than value earned ❌ |
| CPI = 1.0 | On budget |
4.2 Schedule Performance Index (SPI)
"Rate of progress vs plan"
| Result | Meaning |
|---|---|
| SPI > 1.0 | Ahead of schedule ✅ |
| SPI < 1.0 | Behind schedule ❌ |
| SPI = 1.0 | On schedule |
🎯 Index Interpretation
CPI = 0.80 means: For every $1 spent, you only get $0.80 of value
SPI = 0.90 means: For every 10 days planned, you completed 9 days of work
5 Module 5: Forecasting (EAC, ETC, VAC)
5.1 Estimate at Completion (EAC)
Forecasted total cost at project end:
| Formula | When to Use |
|---|---|
| EAC = BAC / CPI | Current cost performance will continue |
| EAC = AC + (BAC - EV) | Original estimates still valid for remaining |
| EAC = AC + (BAC - EV) / CPI | CPI trend continues for remaining work |
| EAC = AC + (BAC - EV) / (CPI × SPI) | Both cost and schedule affect remaining |
5.2 Estimate to Complete (ETC)
"How much more will we spend?"
5.3 Variance at Completion (VAC)
"Final expected over/under budget"
- VAC > 0 = Will finish under budget
- VAC < 0 = Will finish over budget
6 Module 6: TCPI - To-Complete Performance Index
6.1 TCPI Formula
"Required efficiency to meet BAC"
6.2 Interpretation
| TCPI | Meaning |
|---|---|
| TCPI < 1.0 | Easy to achieve - can relax slightly |
| TCPI = 1.0 | Must maintain current efficiency |
| TCPI > 1.0 | Must improve efficiency to meet budget |
| TCPI > 1.2 | Very difficult - consider re-baselining |
7 Module 7: S-Curves and Reporting
7.1 The S-Curve
A graphical representation of cumulative costs, labor, or progress over time. Shows:
- PV curve: Planned cumulative spending (baseline)
- EV curve: Earned value over time
- AC curve: Actual cumulative spending
7.2 Reading the S-Curve
- EV below PV: Behind schedule
- AC above EV: Over budget
- Gap between curves: Magnitude of variance
7.3 EVM Reporting Best Practices
- ✅ Report weekly or monthly depending on project size
- ✅ Include trend analysis (is CPI improving or worsening?)
- ✅ Show variances in both $ and %
- ✅ Include narrative explaining variances
- ✅ Present corrective action plans
8 Module 8: Worked Example
8.1 Project Data
| Metric | Value |
|---|---|
| Budget at Completion (BAC) | $1,000,000 |
| Planned Value (PV) | $400,000 |
| Earned Value (EV) | $350,000 |
| Actual Cost (AC) | $450,000 |
8.2 Calculate Variances
SV = EV - PV = $350,000 - $400,000 = -$50,000
Interpretation: $100K over budget and $50K worth of work behind schedule.
8.3 Calculate Indices
SPI = EV / PV = $350,000 / $400,000 = 0.875
Interpretation: Getting $0.78 value per $1 spent. Progressing at 87.5% of planned rate.
8.4 Forecast Completion
VAC = BAC - EAC = $1,000,000 - $1,282,051 = -$282,051
Interpretation: Project will finish approximately $282K over budget if current trend continues.
📊 Project Status Summary
Status: Over Budget & Behind Schedule
Projected Overrun: ~$282,000 (28% over budget)
Action Required: Immediate corrective measures
🎯 Final Quiz
🧪 Test Your EVM Knowledge
1. What does CPI = 0.8 mean?
2. If SV is negative, the project is:
3. EAC = BAC / CPI is used when:
4. CV = EV - AC measures:
🚀 Practice EVM Now!
Try our EVM Calculator to apply what you learned!