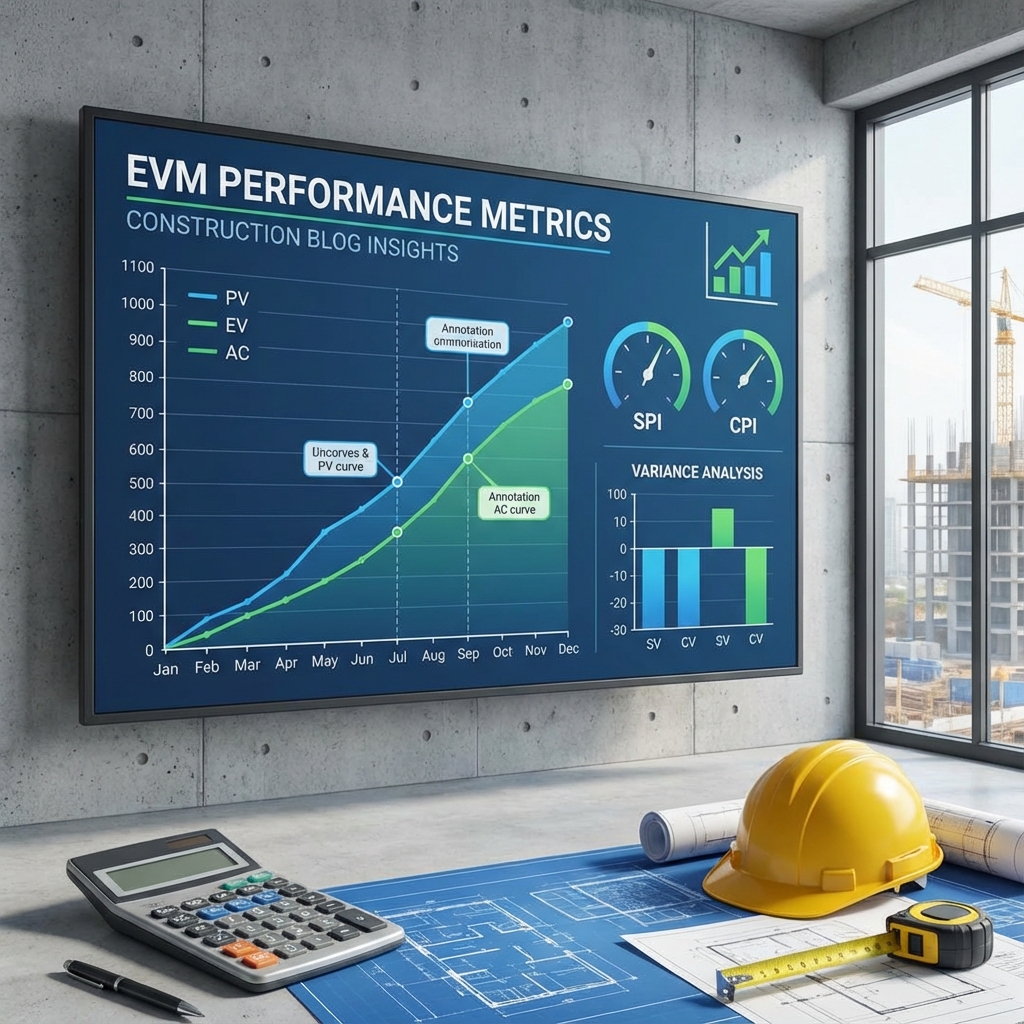
Earned Value Management (EVM) is the most powerful project control methodology available to construction project managers. At its core, EVM combines measurements of scope, schedule, and cost in a single integrated system — giving you an early, objective warning when your project is heading off track. The language of EVM is its metrics: a family of precisely defined values and ratios that describe your project's health with mathematical precision.
In this comprehensive guide, we'll walk through every major EVM metric — from the three fundamental values (PV, EV, AC) to performance indices (SPI, CPI), variance measures (SV, CV), and forecasting tools (EAC, ETC, TCPI) — with clear formulas, interpretation guidance, and a full worked example.
You can also try our free EVM Calculator to apply these formulas to your own project instantly.
📐 The Three Fundamental EVM Values
Everything in EVM is built on three baseline measurements, taken at any given point in time. Let's use a consistent example throughout: a 40-meter retaining wall, planned over 4 working days, at a budgeted rate of $200 per meter (Total Budget = $8,000). You're reviewing progress at the end of Day 2.
1. Planned Value (PV) — Also known as BCWS
Definition: The authorized budget for the work planned to be completed by a given date. This is your baseline — what the schedule says you should have accomplished.
Our Example: By end of Day 2, you planned to complete 50% of the wall (20 meters).
PV = 50% × $8,000 = $4,000
2. Earned Value (EV) — Also known as BCWP
Definition: The authorized budget for the work actually accomplished. This is the "earned" portion of the budget — what you've truly earned by completing physical work. Critically, EV is measured at the planned rate, not the actual cost.
Our Example: By end of Day 2, the crew actually completed only 15 meters (37.5%).
EV = 37.5% × $8,000 = $3,000
3. Actual Cost (AC) — Also known as ACWP
Definition: The actual costs incurred in accomplishing the work performed. This is simply: what did you actually spend?
Our Example: To complete those 15 meters, the crew encountered harder soil conditions and overtime was required. Actual spend = $3,600
📊 Variance Measures: Diagnosing the Problem
With PV, EV, and AC established, we can calculate two critical variance measures that tell us whether our project has a schedule problem, a cost problem, or both.
Schedule Variance (SV)
Our Example: SV = $3,000 − $4,000 = −$1,000
- SV = 0: On schedule ✅
- SV < 0: Behind schedule ❌ (we earned less than planned)
- SV > 0: Ahead of schedule 🚀
Interpretation: We have a negative SV of $1,000 — we are $1,000 worth of work behind schedule. In physical terms: we only completed 15 meters when 20 meters were planned.
Cost Variance (CV)
Our Example: CV = $3,000 − $3,600 = −$600
- CV = 0: On budget ✅
- CV < 0: Over budget ❌ (cost more than the work is worth)
- CV > 0: Under budget 💰
Interpretation: We spent $3,600 to accomplish $3,000 worth of work — we're $600 over budget on what we've done so far.
📈 Performance Indices: Reading Project Health at a Glance
While variances tell you the absolute magnitude of problems, performance indices tell you the efficiency of your work — and these ratios are what experienced project managers watch most closely.
Schedule Performance Index (SPI)
Our Example: SPI = $3,000 ÷ $4,000 = 0.75
- SPI = 1.0: Exactly on schedule ✅
- SPI < 1.0: Behind schedule ❌ — for every $1 of planned work, only $0.75 worth was accomplished
- SPI > 1.0: Ahead of schedule 🚀
Practical meaning: Our crew is working at 75% schedule efficiency. If this trend continues, the 4-day wall project would take approximately 5.3 days (4 ÷ 0.75).
Cost Performance Index (CPI)
Our Example: CPI = $3,000 ÷ $3,600 = 0.83
- CPI = 1.0: Exactly on budget ✅
- CPI < 1.0: Over budget ❌ — for every $1 spent, only $0.83 of value is earned
- CPI > 1.0: Under budget 💰
The critical CPI rule: Studies on large construction projects have shown that the CPI at project's 20% completion rarely improves by more than 10% by project end. A CPI of 0.83 at early stages is a serious warning signal — not a minor blip.
🔮 Forecasting Metrics: Predicting Where You'll End Up
The true power of EVM lies in its ability to forecast project outcomes before the project is complete. Here are the four key forecasting metrics:
Estimate at Completion (EAC)
EAC answers the question: "Based on current performance, what will the project actually cost to complete?" There are three common calculation methods depending on your assumptions:
Use when: Current cost performance is expected to continue throughout the project (most common in construction).
Our Example: EAC = $8,000 ÷ 0.83 = $9,639 — 20.5% over the original budget!
Use when: The cost overrun was a one-time event and future work will perform at the planned rate.
Our Example: EAC = $3,600 + ($8,000 − $3,000) = $3,600 + $5,000 = $8,600
Use when: Both cost and schedule efficiency losses are expected to continue.
Our Example: EAC = $3,600 + [($5,000) ÷ (0.83 × 0.75)] = $3,600 + $8,032 = $11,632 — the most pessimistic scenario.
Estimate to Complete (ETC)
ETC is simply the expected cost to complete the remaining work.
Our Example (using Method 1 EAC): ETC = $9,639 − $3,600 = $6,039
We need $6,039 more to finish a job originally budgeted at $8,000 total.
Variance at Completion (VAC)
Our Example: VAC = $8,000 − $9,639 = −$1,639
A negative VAC means we expect to finish over budget by $1,639.
To-Complete Performance Index (TCPI)
TCPI tells you: "What CPI do I need to achieve on the remaining work to hit the budget?" If TCPI > 1.2, hitting the target is generally considered unrealistic.
Our Example: TCPI = ($8,000 − $3,000) ÷ ($8,000 − $3,600) = $5,000 ÷ $4,400 = 1.14
To finish within the original $8,000, we'd need to work at 114% efficiency on the remaining work — challenging but not impossible.
📋 Complete EVM Metrics Reference Table
| Metric | Formula | Our Example | Interpretation |
|---|---|---|---|
| PV (Planned Value) | Planned% × BAC | $4,000 | Baseline: what should be done |
| EV (Earned Value) | Actual% × BAC | $3,000 | Value of work actually done |
| AC (Actual Cost) | Actual spend | $3,600 | What you actually paid |
| SV (Schedule Variance) | EV − PV | −$1,000 | <0 = behind schedule |
| CV (Cost Variance) | EV − AC | −$600 | <0 = over budget |
| SPI | EV ÷ PV | 0.75 | <1 = behind schedule (75% efficient) |
| CPI | EV ÷ AC | 0.83 | <1 = over budget (83 cents per dollar) |
| EAC (Estimate at Completion) | BAC ÷ CPI | $9,639 | Forecasted final cost |
| ETC (Estimate to Complete) | EAC − AC | $6,039 | Cost to finish remaining work |
| VAC (Variance at Completion) | BAC − EAC | −$1,639 | <0 = will exceed budget |
| TCPI | (BAC−EV) ÷ (BAC−AC) | 1.14 | Efficiency needed to hit budget |
📊 Real Construction Case Study: Road Paving Project
Project: 5 km road paving project | BAC = $500,000 | Planned Duration: 10 weeks
Status Report at Week 4:
- Planned progress: 40% (PV = $200,000)
- Actual progress: 32% (EV = $160,000)
- Actual spend: $185,000 (AC = $185,000)
EVM Analysis:
- SPI = 160,000 ÷ 200,000 = 0.80 → Working at 80% schedule efficiency
- CPI = 160,000 ÷ 185,000 = 0.865 → 86.5 cents earned per dollar spent
- EAC = 500,000 ÷ 0.865 = $578,000 → Will likely cost $78,000 more than budgeted
- TCPI (to meet $500K) = (500K−160K) ÷ (500K−185K) = 340K ÷ 315K = 1.08 → Tight but achievable with corrective action
Project Manager's Action: Reviewed asphalt delivery delays (schedule issue) and discovered fuel surcharges not included in original estimate (cost issue). Added a third paving crew and renegotiated fuel costs, bringing CPI to 0.94 and SPI to 0.95 by Week 6.
🛠️ How to Use EVM Metrics in Practice
- Measure Progress Consistently: EVM is only as good as your progress measurement. Use physical percent complete (meters poured, units installed) not time-based or cost-based estimates.
- Report Monthly (minimum) — Track Weekly: For most construction projects, monthly EVM reporting is the minimum. Experienced project managers track key metrics weekly.
- Set Thresholds for Action: Define in advance: "If CPI drops below 0.90, we escalate to the project sponsor." Don't wait until problems become crises.
- Use EAC for Budget Reforecasting: Update your EAC every reporting period and communicate the updated forecast to management proactively — not after they ask.
- Pair EVM with Schedule Analysis: EVM's schedule metrics (SPI, SV) become less reliable in the final 20% of a project. Pair with critical path analysis for schedule control near project end.
- Integrate with Our EVM Calculator: Use our free EVM Calculator to input your project data and instantly generate all metrics and forecasts.
🔚 Conclusion
EVM metrics transform project control from a subjective art into an objective science. With three simple measurements — PV, EV, and AC — you can derive a complete picture of your project's schedule and cost performance, diagnose problems early, and forecast final outcomes with reasonable accuracy.
The most successful project managers don't wait for problems to become visible in delayed invoices or schedule slippages. They monitor EVM metrics continuously, set action thresholds, and intervene early when performance indices start moving in the wrong direction. Master these metrics, and you'll have the most powerful project control tool available to the construction industry.
Related Articles: